Executive Summary
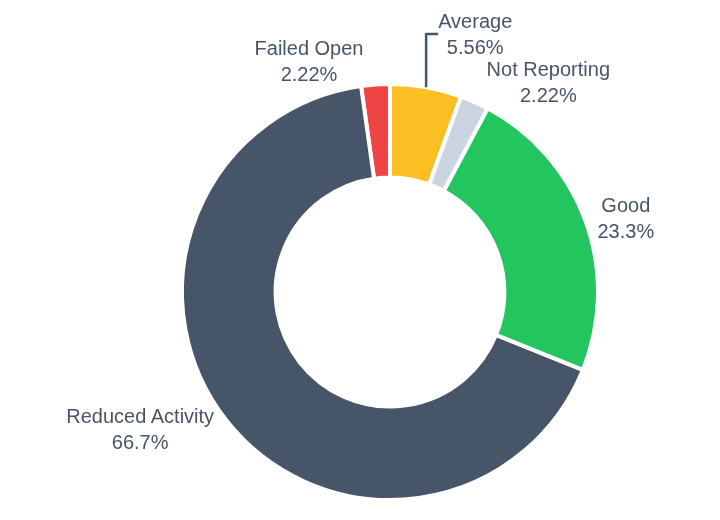
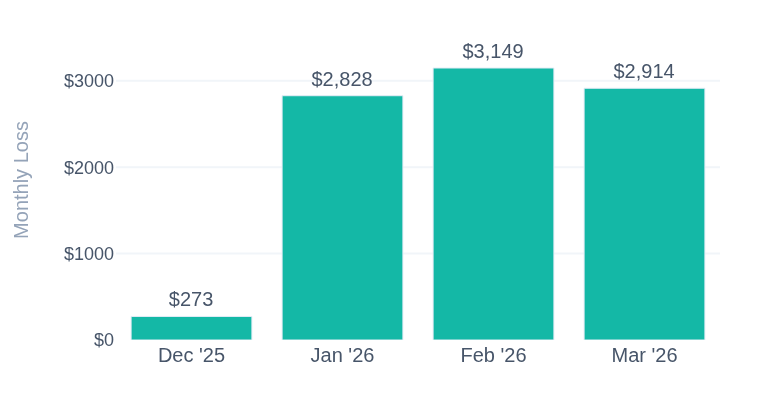
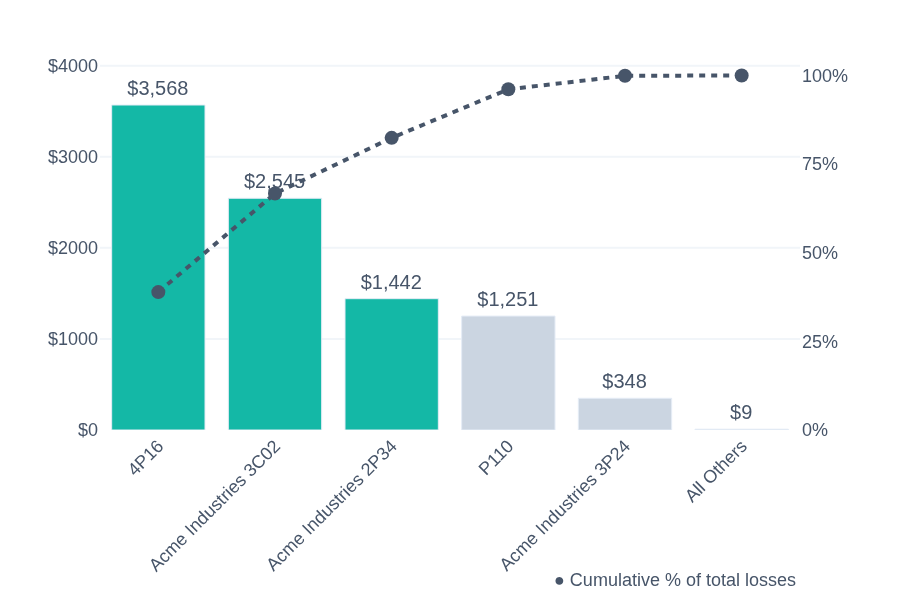
Your fleet is operationally sound — 60% of traps are healthy and all 10 devices are reporting telemetry — but it is carrying a concentrated financial problem. Four traps are in active failure states, and the period recorded $103,318 in steam loss across the fleet. The clearest single opportunity is a small set of failed-open traps: three devices carry sub-week repair payback periods, and the forward-look model estimates roughly $268,412 in annualized loss becomes addressable the moment they're serviced. This is the first monitoring period for the fleet, so these figures establish your baseline — the scoreboard you'll measure progress against.
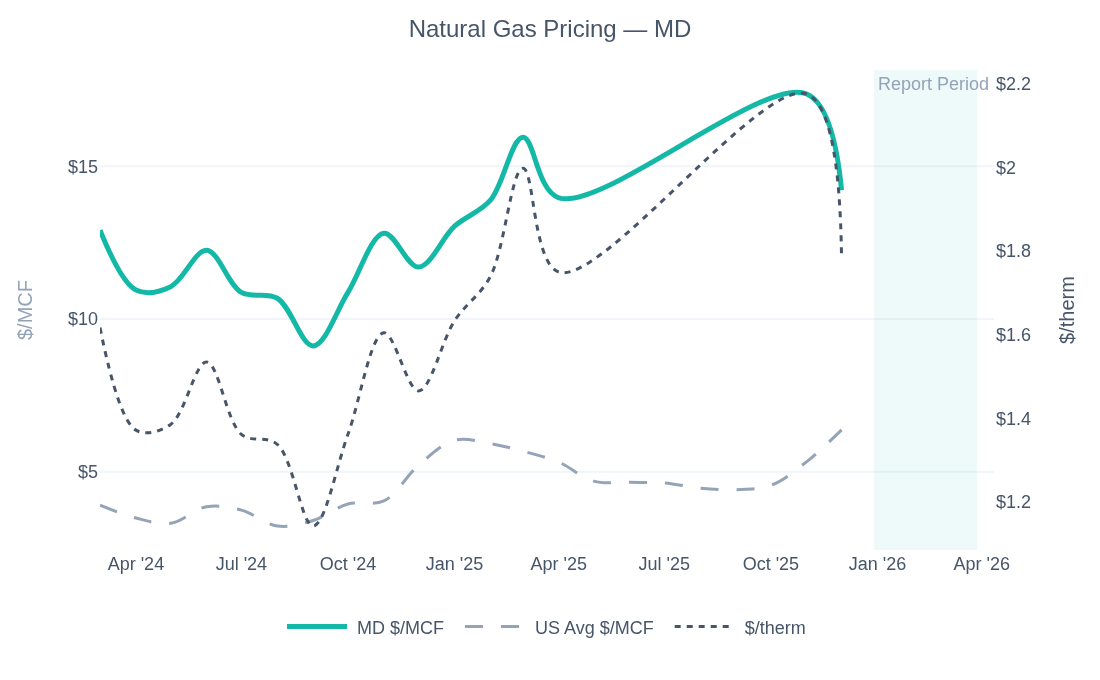
Two things deserve immediate attention. First, the failed-open traps at Northmark Children's Hospital and Cancer Institute are actively wasting steam every hour they run, and Massachusetts gas pricing — currently about 5× the national average — magnifies every therm lost. Second, SteamIQ's analytics engine detected a water hammer event in Sub-Basement Room 4 (Northmark Women's Hospital) with a noted history of recurrence in that zone; water hammer is a safety and equipment-integrity risk that warrants a physical inspection. Below we lay out the health picture, the money story, what our intelligence layer caught, and a prioritized action plan your team can hand straight to a technician.