
THE COMPLETE WHITEPAPER
Is Steam Trap Monitoring Worth It?
The economics of continuous monitoring, for plants that already take steam seriously
SteamIQ, Inc. · Hingham, Massachusetts · August 2026Verified work email required.
In this paper · argument, evidence & methodology
The short answer
The short answer. It depends on your plant, especially how quickly you repair failed traps. In the worked example, 100 traps at US-average gas prices pay back the installed cost in 24.6 months on fuel and survey savings and 11.4 months including production and damage savings. The shorter payback depends on assumed production benefits; use your own costs to judge whether it applies. Cheap gas and slow repairs lengthen the payback. Monitoring does not save energy. Repairs do.
The variable that matters
A failed-open trap burns the boiler’s fuel every hour it runs. The cost keeps growing until the trap is repaired. Earlier detection gives the plant a chance to act sooner.
The Department of Energy is clear about how often traps should be tested: weekly to monthly on high-pressure lines, monthly to quarterly at medium pressure, and only once a year below 30 psig.[1] It calls a system well kept when under 5 percent of traps are leaking. Testing that often by hand takes a sustained maintenance effort. For a plant that checks once a year, failures can go unnoticed for months. Illinois has written down what that costs. Its technical reference manual is the rulebook its utility programs must calculate savings with. That manual assumes a failed trap goes unnoticed for half the year on average. And it puts the fraction of traps found leaking or blowing through at each audit at 16 percent, on industrial and process systems at 15 psig and above.[2] Where no program exists, DOE puts the failed fraction at 15 to 30 percent after 3 to 5 years.[1]
SteamIQ tests each trap 60 times an hour, 525,600 times a year, and reports three times a day; a survey tests once a year. The monitor confirms a failure across several readings before it tells the plant. So the value of monitoring is simple: how much sooner you find out, multiplied by what the failed traps are losing.
The loss rate, measured
SteamIQ puts a dollar figure on every monitored trap, every day. It starts with how much steam is passing through the trap’s opening at line pressure. That becomes therms of gas. Therms become dollars at the customer’s own state gas price. On top sits DOE’s 1.30× multiplier, which covers water treatment, blowdown, labor and maintenance. That is the cost of making steam beyond the fuel itself. The same therms convert to emissions at 11.7 pounds of CO₂ each.[3] Here is how that loss is spread across the traps we have confirmed failed open:
| Position in the measured distribution | Therms per failed-trap-day |
|---|---|
| Median | 6.45 |
| Average | 20.68 |
| 90th percentile | 46.7 |
SteamIQ network measurement through 1 September 2026. The average covers 31,540 failed-trap-days for customers that return condensate.[3]
How this was worked out
Therms are priced only after pressure scaling, at the reader’s 12-month state gas price and DOE’s 1.30× loaded-cost multiplier.
The average is more than three times the median, the trap in the middle of the range. That is because most of the loss sits in a few big failures, at high pressure through a large opening. For planning across a whole plant, the average is the right number to use. Identifying the largest losses helps the plant prioritize repairs. At a 106-trap pharmaceutical site watched for six months, five traps accounted for three-quarters of 15,155 therms lost.[4]
Monitoring does not save energy. Repairs do.
No plant wants to waste steam. Nobody fires a boiler to humidify the outdoors. A failed trap can go unnoticed between surveys. Once it is found, repair may still wait for parts, access or a place on the maintenance schedule. Monitoring closes the first gap. What the plant does with that knowledge decides the second.
A monitor that spots a failed trap saves nothing until someone replaces the trap. What you save is the time you cut off: how much sooner you knew, less how long you take to act. That makes this a management decision as much as an engineering one. Trap repair has to stay on the priority list. Maintenance has to work that list. And the parts have to be on the shelf. SteamIQ tracks the two numbers that show whether it is happening: how long from detection to inspection, and from inspection to repair. Both should be falling.
The parts on the shelf. One of our pharmaceutical customers built its trap program around a single decision: buy the replacement parts before they are needed. The team aims to repair within three to seven days, and sometimes swaps a trap the same day. The parts are there, and the work stays in-house. Where a trap cannot be isolated, the repair waits for a scheduled shutdown. The commitment is to remove the delays that can be removed, and to be straight about the ones that cannot.[5]
That customer has stopped paying for contracted annual surveys. The Department of Energy calls a system well kept when under 5 percent of its traps are leaking; fewer than 5 percent of this customer’s traps are failed at any one time. That counts failed open and failed closed, which is the stricter test. That is the backlog prompt repair leaves behind, not a claim that only 5 percent fail in a year. A utility funded the first installation in 2017 and can see the account to check the records, and at eligible sites it pays for the therms saved, one more reason to repair quickly. Most of this customer’s sites get no utility money at all. It has since taken SteamIQ international and written it into its specification for new builds.[5]
How trap repair compares to other energy projects
Since 1981, university engineering teams funded by the Department of Energy have assessed plants and written up what to fix. The program has recorded 170,055 recommendations across 22,916 assessments. Each one carries an estimated cost, an estimated annual saving, and a follow-up on whether the plant did the work. Ranked by how fast those estimates pay back, steam trap repair is 10th of 126 measures at 3.1 months. It is 4th on how often plants actually do the work.[6] For comparison, variable-speed motor drives, lighting upgrades and heat recovery on the boiler flue all take about a year and a half. Of the nine measures ahead of trap repair, three are changes to how you buy gas or electricity, four are turning a dial, and two are fixing leaks. Not one is equipment you have to buy.
| Rank | Measure | Median payback | Costed recommendations (n) |
|---|---|---|---|
| 1 | Reduce the pressure of compressed air to the minimum required | 1.0 months | 4,371 |
| 2 | Lower temperature during the winter season and vice-versa | 1.3 months | 645 |
| 3 | Chill water to the highest temperature possible | 1.4 months | 147 |
| 4 | Apply for tax-free status for energy purchases | 1.6 months | 794 |
| 5 | Repair and eliminate steam leaks | 2.1 months | 851 |
| 6 | Purchase gas directly from a contract gas supplier | 2.4 months | 247 |
| 7 | Change rate schedules or other changes in utility service | 3.0 months | 669 |
| 8 | Eliminate leaks in inert gas and compressed air lines/ valves | 3.0 months | 10,467 |
| 9 | Reduce illumination to minimum necessary levels | 3.1 months | 1,714 |
| 10 | Repair or replace steam traps | 3.1 months | 428 |
| — | For comparison: common capital measures | ||
| 97 | Use waste heat from hot flue gases to preheat | 18.8 months | 1,911 |
| 101 | Use adjustable frequency drive or multiple speed motors on existing system | 19.2 months | 5,124 |
| 106 | Utilize higher efficiency lamps and/or ballasts | 20.2 months | 19,447 |
Measures in DOE’s “Energy Management” branch, ranked by median payback. The median is the middle result, not the average. Only measures with at least 100 recommendations carrying a positive implementation cost are ranked. Measure names follow DOE’s ARC List v21.1.[6]
How this was worked out
The branch is every ARC code beginning 2. For each recommendation, payback is implementation cost divided by annual savings; measures are ranked by the median of those results in months, with non-positive annual savings excluded. DOE’s published simple-payback field is populated only through FY2011 and empty from FY2012 onward, so it cannot support a 1981–2026 ranking. Ranks 7 through 10 fall within a tenth of a month of one another.
The savings depend on keeping traps working. Illinois credits a trap repair with six years of savings. It credits lighting or drives with fifteen.[7] Traps fail again, so the savings from a one-off repair campaign fade away. Monitoring helps the plant find new failures and sustain those savings through prompt repair. Berkeley Lab lists “automatic steam trap monitoring” as a measure in its own right, at a one-year payback.[8] The federal energy office measured the same effect. In buildings with no trap maintenance program, close to 20 percent of steam was lost through traps. With an average program, about 6 percent. With continuous monitoring, it concluded, “the loss rate should approach 0%.” That same report says continuous monitoring is probably not worth it in most federal buildings, because their heating traps are small. A process plant is the opposite case.[9] The trap programs it measured paid back in three weeks to three months.
From readings to a job list
The harder problem is turning a signal into a work order. A trace on a screen tells an expert a great deal. But reading a trap’s sound at a given pressure and load, spotting when the trouble started, and deciding who to send where first: that is specialist knowledge. The specialist is rarely the person at the screen. That gap, between knowing and doing, is where most of the energy stays lost. SteamIQ is built to close it. The system does the interpreting and hands the plant the job.
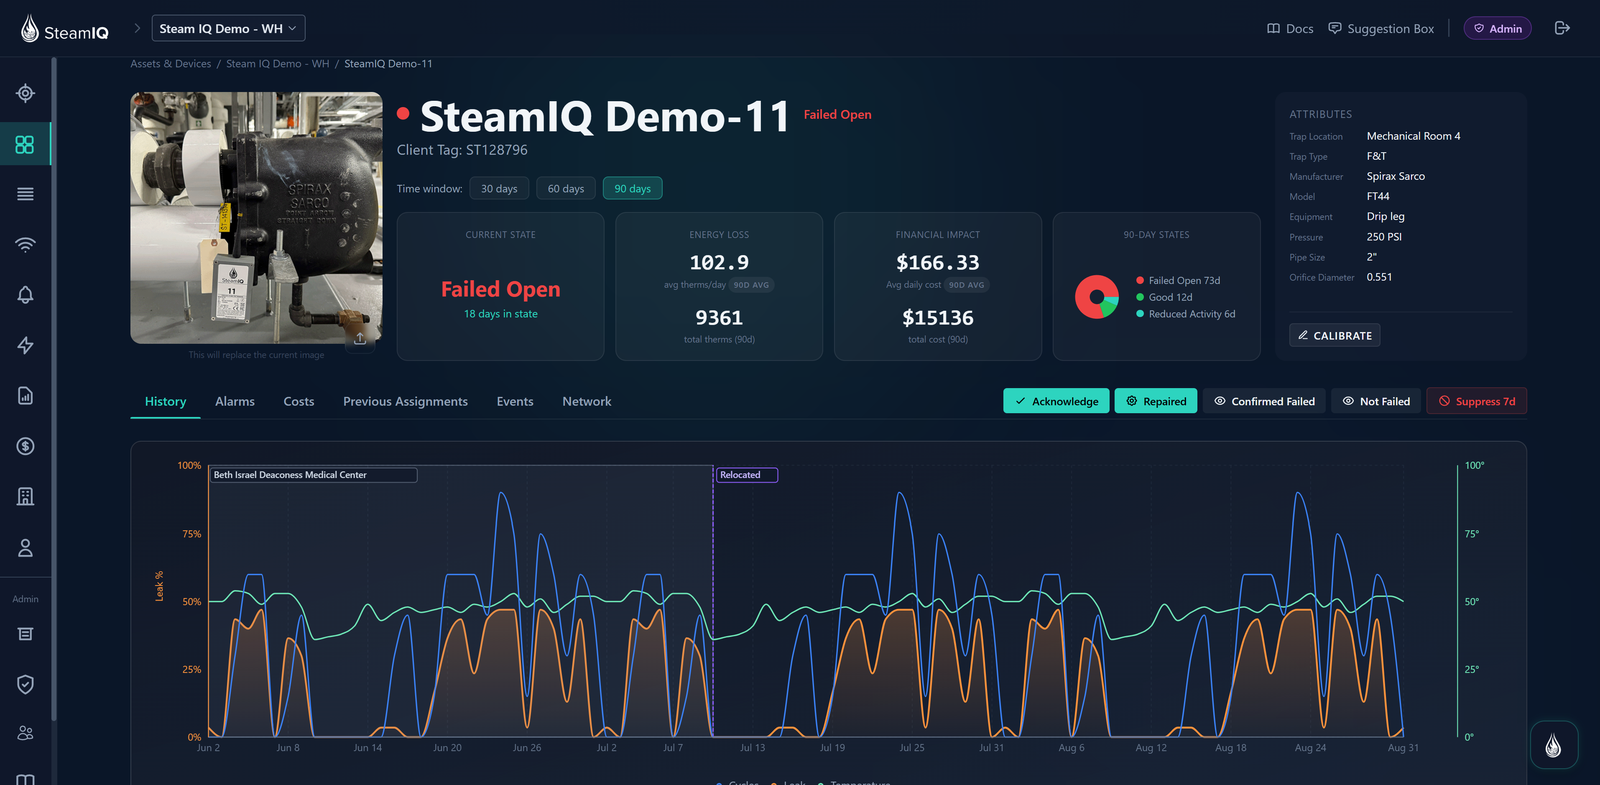
Each monitor records sound, cycle count and temperature every minute, and shock continuously, for the life of the trap. Over months that builds a full history of every trap: when the trouble started, how the load moves through the year, and what each repair actually changed. The system works through that history before a word of the Fleet Report is written. Here is what it works out for you, and what a screen full of traces would leave you to work out yourself:
- When it started, and what it has cost. Not just that a trap is failed open, but since when, what it has cost so far, and how fast the bill is growing. A trap seven days into failure is a different job from one at thirty-one days. The Fleet Report says so, and explains why acting early caps the loss.[10]
- New failures or newly confirmed failures. When a fleet health score drops, the system separates new damage from failures it had been tracking all along and has now confirmed. A part month is marked as a part month, not read as a trend.
- Traps that fail together. When several traps show the same trouble in the same window, the system names the likely shared cause: a common condensate return, a pressure zone, an installation crew, dirty steam. It warns that replacing those traps without fixing the shared cause invites the same failure again. On one campus system, seven traps that failed together were flagged as a header problem, not seven separate faults.[10]
- Jobs that belong on one visit. A failed-closed trap in the zone next to a water hammer event is put on the same inspection visit. The Fleet Report makes the connection.
- When to act, and what waiting costs. Gas is priced by the customer’s own state and month. Massachusetts industrial gas swings more than 100 percent between its April peak and October trough. Where the swing is that steep, the Fleet Report projects what leaving today’s failures unrepaired will cost through the coming months, and says when acting is cheapest.[3]
- Whether the repair worked. Every repair is checked against the trap’s own readings afterwards. A repair that did not work is flagged for another inspection: for example, a trap losing $39 a day before repair and $37 after.[10]
- Where it is not sure. A trap showing a big loss signal but no daily loss is flagged as a disagreement to settle before anyone is sent out. Where the evidence is thin, the Fleet Report says so.[10]
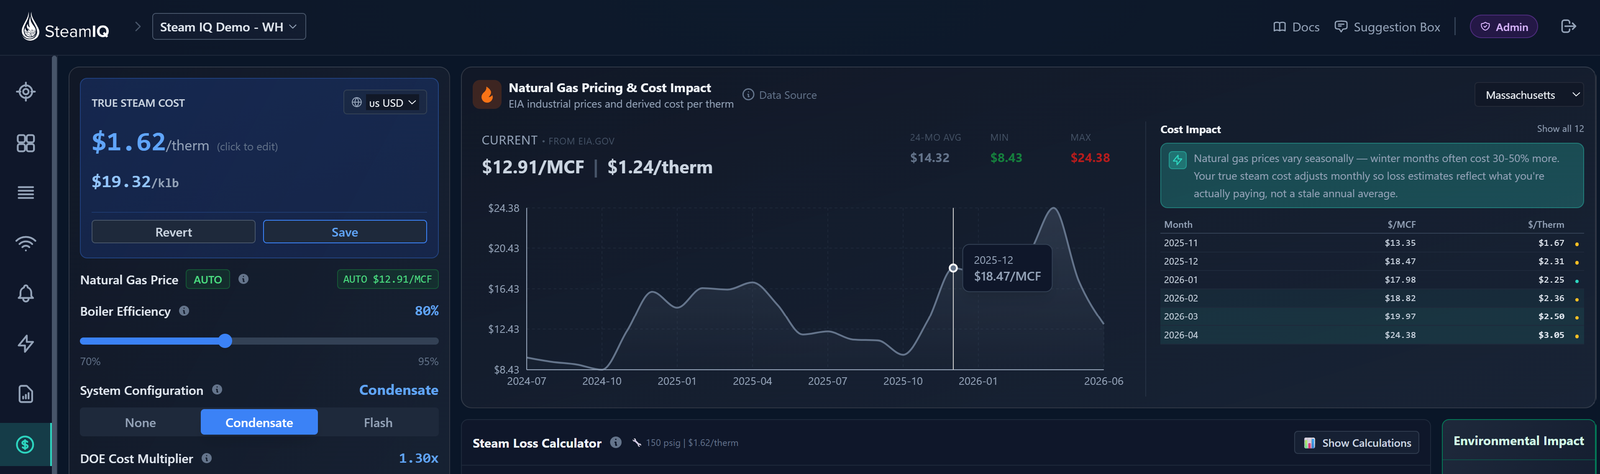
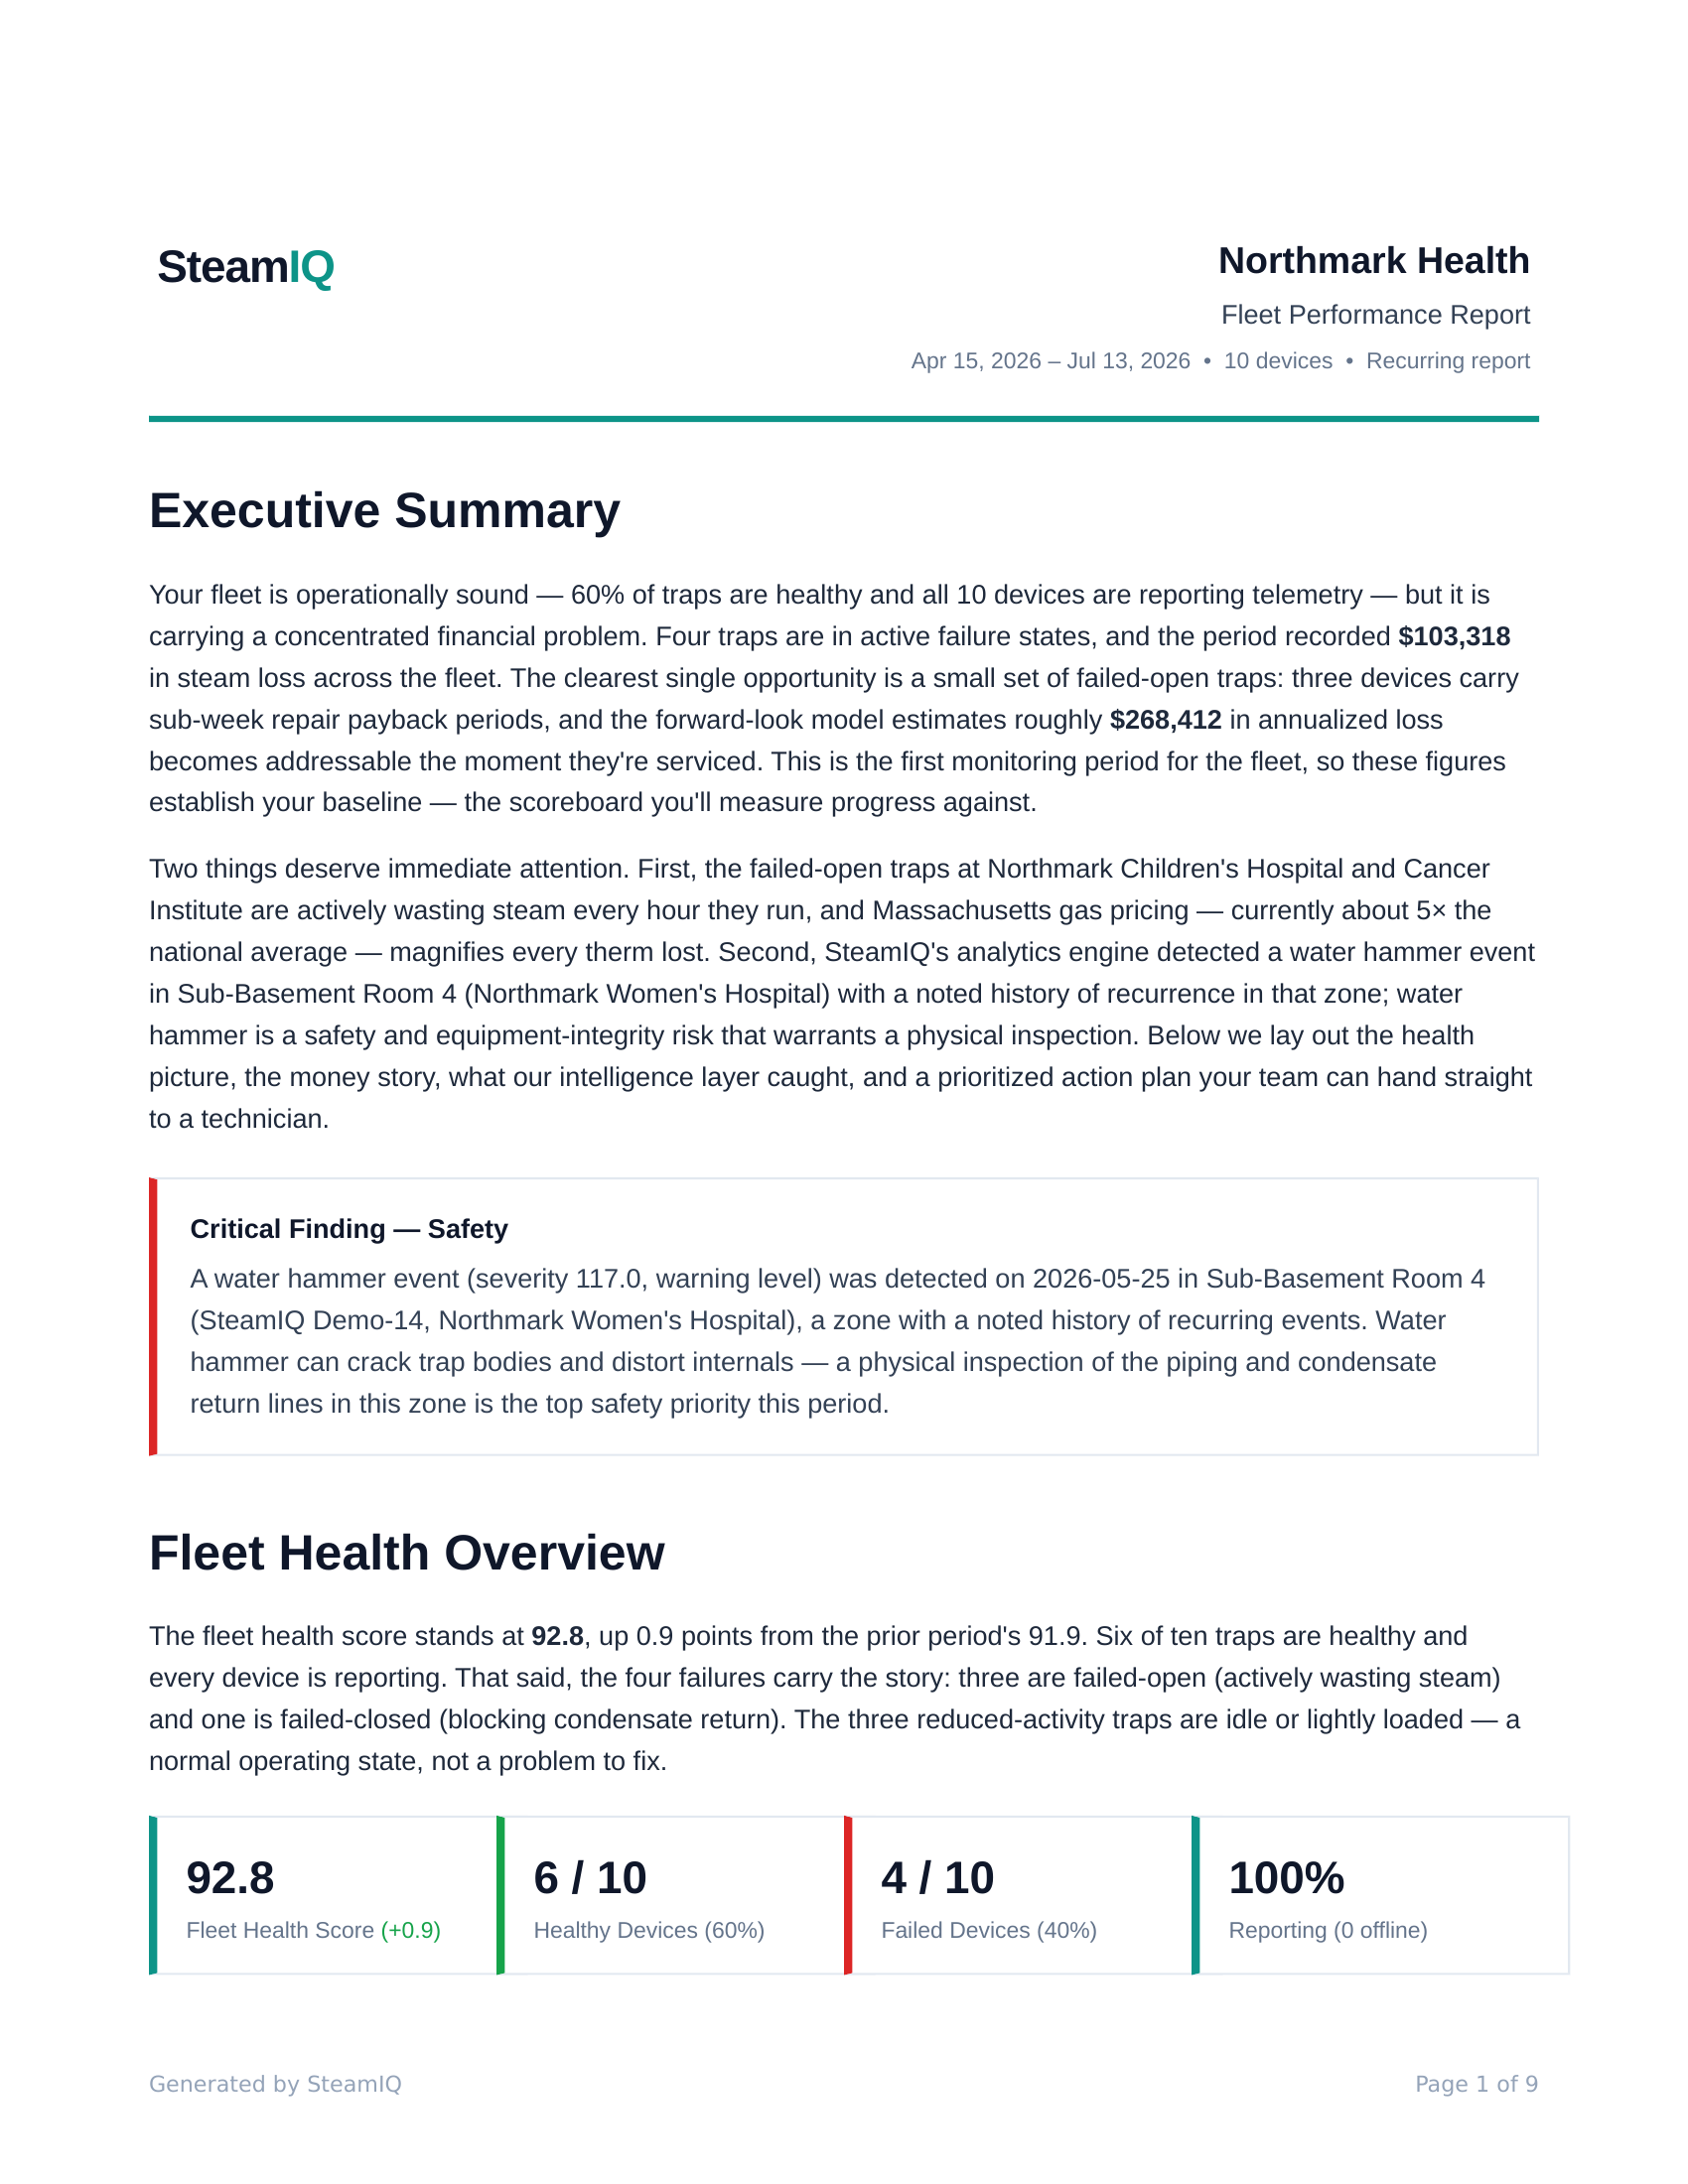
The Fleet Report is built from figures already checked against the database, and every figure is checked again after the words are written. Traps are classified by how much of the opening is leaking, not by computed flow: a ¾-inch opening at 15 percent passes more steam than a 3/32-inch opening at 40 percent. And a failure is confirmed across several readings before the plant is told.
How this was worked out
As a release check, a report is withheld if its money figures disagree with each other by more than 15 percent. This checks consistency between the reported figures; it does not measure the accuracy of the underlying loss estimates.
What lands on the plant manager’s desk is short. A summary they can read in two minutes. A ranked repair list with location, estimated cost and payback in days. Jobs sorted into this week, this month and this quarter. And a running cost of doing nothing on every open item. A daily note and a weekly digest carry the same findings at shorter length. None of it asks you to read a trace.
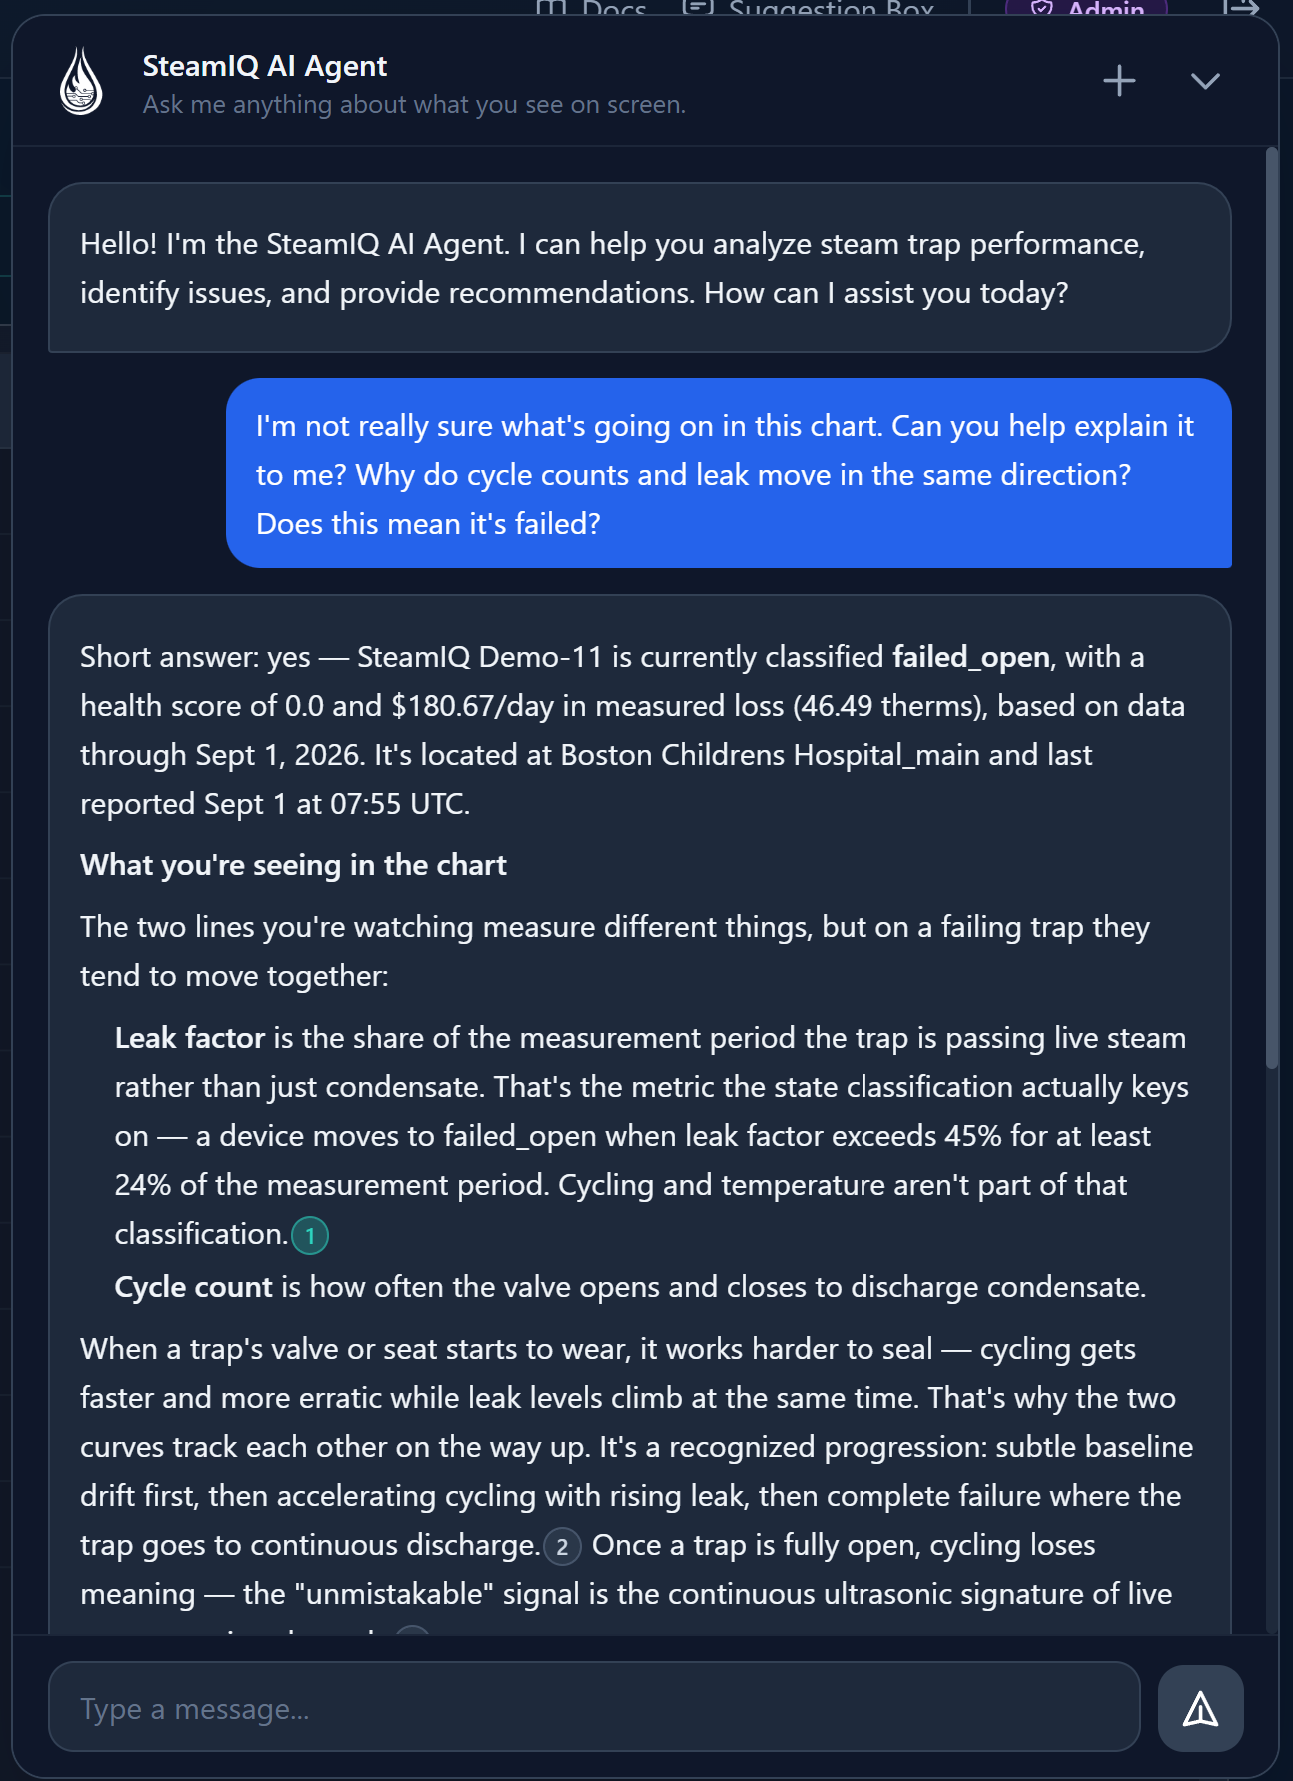
You can also just ask. An operator can ask in plain language which traps failed this quarter, what a particular header cost last month, whether a repair worked, or what a classification means. The answer is drawn from the same checked database the Fleet Report is built on, not from a general model’s memory. Operators can explore the findings by asking questions in their own words. The expert knowledge about how a trap behaves at a given pressure and load lives in the system, not in the person at the keyboard. The plant can investigate its own data without waiting for a call back.
The data belongs to the plant. Everything we compute is available through our interface and in standard file formats: trap states, loss figures, signals, repair checks. Findings can flow straight into the plant’s own maintenance system as work orders, and into its energy or sustainability records as verified savings. For a plant that documents maintenance for compliance, the time-stamped record of detection, inspection and repair is an audit trail it did not have to build.
The payback, worked
Take 100 traps at 145 psig. Assume 20 percent are found failed at the annual survey, that survey costs $75 a trap, repairs happen 14 days after detection, and US-average gas at the worked $0.5139 per therm. For production, the boxes start at $10,000 an hour and 4 hours per stop, with annual downtime and hammer repair spend both left blank. Installed cost is $100,000. The annual fee is $5,000, which is $2,500 less than the survey it replaces. The payback calculation on this page uses these assumptions, plus your own trap count and gas price.
| Repair lag with SteamIQ | Loss today | Loss with SteamIQ | Saved / year | Surveys minus fee | Payback, fuel and survey savings | Payback, including production and damage savings |
|---|---|---|---|---|---|---|
| 14 days (default) | $50,000 | $4,000 | $46,000 | $2,500 | 24.6 months | 11.4 months |
| 30 days | $50,000 | $8,000 | $43,000 | $2,500 | 26.6 months | 11.9 months |
| 90 days | $50,000 | $22,000 | $28,000 | $2,500 | 39.0 months | 13.8 months |
| 180 days | $50,000 | $43,000 | $7,000 | $2,500 | 10.7 years | 18.4 months |
| 209 days | $50,000 | $50,000 | $0 | $2,500 | not on fuel alone | 20.5 months |
Loss uses 20.68 therms per failed-open trap per day, measured through 1 September 2026 across 31,540 failed-trap-days and priced at the published US 12-month average.[2][3]
How this was worked out
Therms are scaled to pressure and carry the 1.30× loaded-cost multiplier. The failure rate counts all failures, open and closed; loss charges only the 86 percent open share. The annual-survey baseline is 212 leak-days; the SteamIQ case is 3 detection days plus the selected repair lag. Day-one backlog and trap repair cost are excluded. The repair lag is the wait for a leaking trap, which wastes fuel but rarely stops a line. A trap that fails closed on equipment that matters is answered on its own urgency. The column including production and damage savings uses the paper’s published production inputs: $10,000 per hour, 4 hours per stop, no annual downtime total and no hammer damage repair spend. That line does not move with repair lag.
At those inputs, one failed-open trap loses $13.82 a day all-in. Loss today, under the annual survey, is $50,000. With SteamIQ it is $4,000. Acting sooner saves $46,000, rounded to the nearest thousand. The surveys you stop paying for cover the fee with $2,500 to spare. So the exact annual net is $48,838 on fuel and survey savings and $104,838 including production and damage savings. The difference is $56,000 of avoided production stops, and that is an assumption, not a measurement. Payback is 24.6 months on fuel and survey savings and 11.4 months including production and damage savings.
Two things are deliberately left out: the traps already failed on day one, and the cost of the replacement traps themselves. The day-one backlog is extra upside in the first year, and the same traps get repaired either way. The “Fuel and survey savings” case counts avoided steam losses, including the loaded costs described above, plus the surveys you stop buying, less the annual monitoring fee. The “Including production and damage savings” case adds avoided production stops and any water hammer repair savings you enter. Production starts from the published $10,000-per-hour reference, and the reader can clear it or replace it with their own value. “Beyond the fuel bill” explains it.
Repair speed strongly affects fuel savings. Stretch the repair to 90 days and fuel saved drops to $28,000. That is 39.0 months on fuel and survey savings and 13.8 months including production and damage savings. At 180 days it is $7,000: 10.7 years on fuel and survey savings, 18.4 months including production and damage savings. At 209 days the SteamIQ case and the annual survey both carry 212 days of leaking, so fuel saved is exactly $0. Only the $2,500 survey saving is left: payback reads “not on fuel alone” on fuel and survey savings and 20.5 months including production and damage savings.
The repair lag on this table is the wait for a leaking trap. A leaking trap wastes fuel and can drag throughput, but it rarely stops a line, so it waits its turn. A trap that fails closed on equipment that matters stops or slows the line, and a plant answers that on its own urgency rather than from the trap-repair queue. That is our assumption, not a measured response time. It is why the interruption line does not move with repair lag: its planning proxy is priced on failures, not leak-days. The half factor already carries the stops that are not caught in time. If your plant is slow to answer a stopped line as well, clear the $/hour box and read the fuel and survey savings column.
Gas price matters too. For the same plant in different states, Massachusetts at $1.5084 a therm is 8.7 months on fuel and survey savings and 6.2 months including production and damage savings. Illinois at $0.8157 is 15.8 months on fuel and survey savings and 9.1 months including production and damage savings. Texas at $0.3657 is 33.8 months on fuel and survey savings and 13.1 months including production and damage savings.
This is a back-of-envelope check, not a full plant study. It assumes you survey at least once a year and return condensate. The failure rate is the fraction found failed open or closed at an annual survey. The model charges only the 86 percent open share a full leak-period, so the 20 percent default prices 17.2 open failures per 100 traps. A 20 percent failure rate, open and closed, sits inside DOE's 15–30 percent no-program range and below the 25.5 per 100 the SteamIQ fleet measured (22.0 open + 3.5 closed). It prices 17.2 open failures per 100 traps, above the Illinois technical reference manual's open-only 16 and below the fleet's 22.0 failed open.
The 20.68 measured therms are scaled to your pressure first, then priced at your own 12-month gas price, then multiplied by 1.30. Pressure scaling is approximate because the measured blend mixes pressures and the larger losses sit at higher pressure. The system does not create extra repairs. It moves them earlier and points them at the traps costing the most. Where utility programs exist, the $1,000-per-trap capital figure may come down.
Regulators reached the same place by a deliberately cautious route. Illinois credits continuous monitoring as a savings measure in its own right: 395 therms per monitored trap per year at 75–125 psig, after cutting its own estimate in half twice. There is money on the table, too. Ameren Illinois’s 2026 metering and monitoring program may cover the full cost, up to $30,000. Nicor Gas’s 2026 commercial rebate pays $300 per industrial or process steam trap at 15 psig and above, once the required survey is done.[11] Check your own utility before you budget.
Beyond the fuel bill
Failed-closed traps. A trap that fails closed wastes no steam, so a leak-only monitor never sees it. But the heat exchanger or jacketed vessel behind it floods and loses capacity. And that backed-up condensate is the charge that fires water hammer. Temperature alone cannot tell a trap that is quietly working from one that has stopped. SteamIQ’s patented cycle counting picks out each individual discharge, so a trap that has gone silent is flagged, usually before its temperature has moved at all.
Production interruptions, counted once. One failed-open trap does not stop a plant; a trap that fails closed on equipment that matters can. Across the SteamIQ network, the measured counts were 22.0 failed open and 3.5 failed closed per 100 traps, a combined failure rate of 25.5 percent, through 2 September 2026. The 14 percent closed share is the closed count divided by the combined open-and-closed count, rounded.[3] The interruption estimate (failures × 0.14 × hours per stop, starting at 4 hours) is a planning proxy for all steam-related stops, including failed-closed traps and water hammer; it is not a measured count of production stops or a measured water-hammer frequency. Your own total annual steam-related downtime replaces the proxy; it is never added to it. Failed-closed traps and water hammer share one interruption line because the same stop can be both. The estimate prices those hours at the value per hour in the box and applies 50 percent once. The production half factor is SteamIQ’s own judgment, not a published factor: it allows for one production line stopping rather than the whole plant, for capacity loss short of a full stop, and for closed traps not caught in time. The value box begins at $10,000 per hour, sourced to ABB’s 2025 study; the reader can clear it or replace it with their own value.
Where four hours comes from. The hours-per-stop input begins at 4, SteamIQ’s own starting point. A steam stop has to drain and reheat. It sits between an approximately one-hour all-cause average calculated from published totals and a published 6-hour hammer outage. Neither source establishes a typical steam stop: the Siemens figure covers all causes, and the Emerson figure is one incident at one plant. The box is yours to change.
How this was worked out
Siemens/Senseye’s The True Cost of Downtime 2024 surveyed large plants in automotive, consumer-goods, heavy-industry and oil-and-gas. It reports that an average large plant loses 27 hours a month to unplanned downtime across 25 incidents, all causes. The one hour per incident is SteamIQ’s own division of those two figures, not a figure the report publishes. Emerson’s November 2014 white paper reports a 6-hour site shutdown after severe water hammer from four plugged traps at one unnamed plant.[12]
What an hour is worth. Published figures are reference points for that question, not a claim about any reader’s plant. For a manufacturer, a stopped pharmaceutical or food line can mean a lost batch and real production money. A campus on low-pressure heating steam has no production stop. For that reader, the “Fuel and survey savings” case is the whole answer unless a hammer repair bill applies.
How this was worked out
ABB’s Value of Reliability: Survey Report 2023 surveyed 3,215 plant maintenance leaders worldwide and reported a $124,669-per-hour median across industry; its sector table lists $84,681 for food and beverage without naming the statistic. ABB with Sapio Research surveyed 3,600 senior decision-makers across sectors; as published by Food Engineering, 47 percent put an hour between $10,000 and $99,999, 29 percent between $100,000 and $499,999, and 7 percent above $500,000. ABB’s own release said 83 percent put the cost at a minimum of $10,000 per hour.[12]
Water hammer damage repair. The reader’s annual spend repairing hammer damage has its own line, separate from lost production time. It starts blank and counts as $0 until the reader enters their own spend; half is counted as savings, our judgment rather than a published factor. SteamIQ locates hammer; it does not prevent it. The saving comes from what location makes possible: an event is placed and the trap most likely feeding it is named, so the damage stops compounding instead of being found at the next bang. If the value per hour is left empty, repair savings still count toward the combined total. We claim no hammer frequency, fleet rate, probability or average cost from our fleet.
Not counted. The estimate leaves out throughput drag from failed-open traps raising return-line pressure and the 9.7 traps per 100 that ran cold (cold with no cycling, but not confirmed failed closed because the trap may be legitimately idle). Both remain upside beyond the priced case. The production estimate can also run high. It will if the network’s closed share does not hold in the reader’s fleet, if a failed-closed trap reduces capacity without stopping the line, or if the real stop is shorter than the hours entered. The production half factor is meant to absorb the last two. Safety is never priced: people hurt by a failed trap or by hammer are never given a dollar figure, on any line, in any total.
Water hammer. Closed or clogged traps let condensate accumulate in a live steam line, and that is what makes hammer the failure mode that connects a trap program to plant safety. Water is roughly 1,200 times denser than steam. Condensation-induced hammer is the dangerous form. In it, a pocket of steam is trapped against cold condensate and collapses in milliseconds. The slug of water that fills the void hits the pipe wall at pressures well above design.[13] The damage is cumulative: cracked welds, eroded seats, bent stems, broken supports and, in the worst cases, ruptured pipe. It is also self-reinforcing. Hammer damages downstream traps, which back up more condensate, which produces more hammer. A plant that learns of it when someone hears the bang has usually been accumulating damage for some time.
Two fatal ruptures. On 18 July 2007 a Con Edison steam main ruptured at 41st Street and Lexington Avenue. New York’s Department of Public Service (NY DPS) found the cause was condensation-induced water hammer: rain and groundwater reaching the buried main had condensed the steam inside it until the section filled, one primary causal factor, and traps “nearly completely clogged with debris” were the second. One person died after suffering a heart attack while fleeing; two people were seriously burned and many others were hurt. The utility’s own costs ran to tens of millions of dollars; source 14 records them. Those are its costs, not a price on a life or a typical plant repair bill.[14] On 22 March 2024, two crew members aboard the cruise ship Nieuw Amsterdam, calling at Half Moon Cay in the Bahamas, died after steam hammer (the Dutch report’s term for the same condensate-driven hammer) ruptured an expansion joint. The Dutch Safety Board’s October 2025 report found that the steam traps on that line had been closed (shut, not failed; the Board could not find out why), so condensate built up in the pipe, and that a valve normally left slightly open to keep the pipe warm had been fully closed, turning that pipe into a dead end. These incidents establish consequences and causes, not how often hammer will occur in your plant.[15]
It is also intermittent, concentrated at startup and off-hours, and rarely witnessed, which is why it is so hard to manage by inspection. SteamIQ monitors carry a three-axis accelerometer sampling continuously. An impact is time-stamped, scored for severity and correlated across neighboring monitors to locate it, so the plant knows where to look. Because every event is recorded, a zone’s history of recurrence is visible. The Fleet Report for a hospital system flagged a single sub-basement event precisely because that zone had a record of them. The failed-closed trap most likely to be feeding it is named for the same visit. The method is patented and, to our knowledge, offered by no other trap monitor.
The instrument
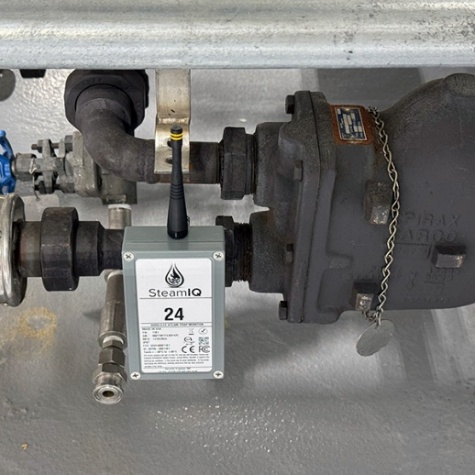
A SteamIQ monitor mounts on the trap. It measures sound carried through the metal, temperature, and shock in three directions, on a battery designed to last 12 to 15 years. Trap health goes out three times a day over LoRaWAN, a long-range radio: no wiring, no site Wi-Fi, no pairing each device to a gateway, and one gateway serves dozens of monitors. It is sealed to IP67, rated from −40 °C to +80 °C, made in Hingham, Massachusetts, and protected by three US patents.
Is it worth it?
Monitoring is worth it when the savings from earlier repairs cover the installed cost and annual fee. Use the worked example to test that against your plant’s gas price, repair times and production costs.
Monitoring earns its return when the plant acts on what it finds. Earlier detection, clear repair priorities and parts on the shelf shorten the time between failure and repair. SteamIQ helps the team find the problem, decide what to fix first and confirm that the repair worked.
Sources
- U.S. Department of Energy, Advanced Manufacturing Office, Inspect and Repair Steam Traps, Energy Tips: STEAM, Steam Tip Sheet #1, DOE/GO-102012-3401, January 2012. DOE tip sheet ↗ OSTI record ↗
- Illinois Statewide Technical Reference Manual for Energy Efficiency, Version 14.0, Volume 2: Commercial and Industrial Measures, effective 1 January 2026 (issued 19 September 2025), §4.4.58 “Steam Trap Monitoring System,” pp. 643–650. Illinois Commerce Commission ↗
- SteamIQ network measurement of failed-open trap loss: 20.68 therms per failed-trap-day across 31,540 failed-trap-days, through 1 September 2026. The failure-state window was refreshed the following day. Across 1,794 devices with a classified state at 32 customers in the trailing year through 2 September 2026, 395 failed open (22.0 per 100 traps), 63 failed closed (3.5 per 100) and 174 ran cold without a confirmed closed failure (9.7 per 100); closed failures are 14 percent of confirmed open and closed failures after rounding. Gas prices are trailing 12-month averages from the US EIA industrial series by state; loaded-cost multiplier per DOE Industrial Technologies Program; emission factor per EPA 40 CFR Part 98 Subpart C.
- SteamIQ Return on Investment Analysis, 106-device pharmaceutical site, August 2025 – February 2026.
- SteamIQ account of a pharmaceutical customer’s steam trap program, September 2026: repair targets and spares policy, cancellation of contracted annual surveys, utility funding and pay-for-performance arrangement dating from 2017, international deployment, and inclusion in the customer’s specification for new builds. The customer is anonymous. These are SteamIQ’s own observations of a customer’s practice, not an independently audited case study.
- U.S. Department of Energy, Industrial Training and Assessment Centers Database, file downloaded 2 September 2026 (ITAC_Database_20260902.xlsx), Rutgers University Center for Advanced Energy Systems; ranking by median simple payback among measures with at least 100 costed recommendations. ITAC database ↗ DOE ARC List v21.1 ↗
- Illinois Statewide Technical Reference Manual for Energy Efficiency, Version 14.0, Volume 2, §4.4.16 “Steam Trap Replacement or Repair,” p. 390; §§4.5.4, 4.5.7 and 4.5.8 for lighting; §§4.4.17 and 4.9.11 for variable-speed drives. Illinois Commerce Commission ↗
- Einstein, D., Worrell, E., and Khrushch, M., Steam Systems in Industry: Energy Use and Energy Efficiency Improvement Potentials, LBNL-49081, Lawrence Berkeley National Laboratory, July 2001. Presented at the ACEEE 2001 Summer Study on Energy Efficiency in Industry. OSTI record and full text ↗
- U.S. Department of Energy, Federal Energy Management Program, Steam Trap Performance Assessment: Advanced technologies for evaluating the performance of steam traps, Federal Technology Alert, DOE/EE-0193, July 1999. Produced for DOE by Pacific Northwest National Laboratory under the New Technology Demonstration Program. Federal Technology Alert ↗
- Illustrations drawn from SteamIQ fleet reports: a 44-device campus steam system, December 2025 – March 2026, and the sample Fleet Performance Report for a ten-trap hospital system in Massachusetts, April – July 2026, available on the SteamIQ website. SteamIQ reports ↗
- Ameren Illinois Energy Efficiency Program, Metering & Monitoring Application, 2026 (Rev. 01.02); Ameren Illinois Energy Efficiency Program, Standard Steam Trap Repair/Replacement Application, 2026 (Rev. 01.03); Nicor Gas, Steam traps, 2026 Commercial rebate application. Ameren Metering & Monitoring application ↗ Ameren Steam Trap Repair/Replacement application ↗ Nicor Gas steam trap rebate application ↗
- Downtime reference points: ABB with Sapio Research, Modernization for Resilience, surveyed 3,600 senior decision-makers across sectors and was released in Zurich on 14 October 2025; Food Engineering, 20 January 2026, published that study’s bands of 47 percent at $10,000–$99,999 per hour, 29 percent at $100,000–$499,999 per hour and 7 percent above $500,000 per hour. ABB’s own release said 83 percent put the cost at a minimum of $10,000 per hour. ABB’s Value of Reliability: Survey Report 2023 surveyed 3,215 plant maintenance leaders worldwide and reported a $124,669-per-hour median across industry; its sector table lists $84,681 for food and beverage without naming the statistic. Siemens/Senseye, The True Cost of Downtime 2024, surveyed maintenance, engineering and IT professionals at large automotive, consumer-goods, heavy-industry and oil-and-gas organizations (no pharmaceutical or life-science plants) and reports that an average large plant loses 27 hours a month to unplanned downtime across 25 incidents, all causes; the one hour per incident is SteamIQ’s own division of those two figures, not a figure the report publishes. Emerson, Impact of Failed Steam Traps on Process Plants, white paper 00870-0200-4708, November 2014, describes a 6-hour site shutdown after severe water hammer from four plugged traps at an unnamed plant. The 4-hour stop is SteamIQ’s own starting point between those references, not a duration either study measured. ABB 2025 study release ↗ Food Engineering report of the ABB 2025 bands ↗ ABB 2023 survey report ↗ Siemens/Senseye The True Cost of Downtime 2024 ↗ Emerson Impact of Failed Steam Traps on Process Plants, 2014 ↗
- Jiann-Lin Chen, Tzu-Chen Hung, S. Kong Wang and Bau-Shi Pei, “Initiation of Water Hammer in a Steam/Water Pipe with a Non-Condensable Gas,” paper 530-278, Proceedings of the 3rd IASME/WSEAS International Conference on Heat Transfer, Thermal Engineering and Environment, Corfu, Greece, 20–22 August 2005. The paper’s full text is no longer downloadable; page numbers could not be confirmed. See also U.S. Department of Energy, Improving Steam System Performance: A Sourcebook for Industry, 2nd ed. (2012). Conference programme ↗ DOE steam system sourcebook ↗
- New York State Department of Public Service, Report on Steam Pipeline Rupture, 41st Street & Lexington Avenue, Case 07-S-0984, February 2008; Consolidated Edison Inc., FY2007 Form 10-K (annual report to the US Securities and Exchange Commission), Note H, “Manhattan Steam Main Rupture.” The DPS report identifies condensation-induced water hammer as the cause of the rupture, water reaching the buried main and condensing the steam inside it as one primary causal factor, and steam traps nearly completely clogged with debris as the second, with one fatality, two serious burn injuries and many lesser injuries. The 10-K records estimated operating costs of $23 million and $17 million in capital, retirement and other costs by 31 December 2007, against $10 million in actual and expected insurance recoveries, with litigation exposure unable to be estimated. NY DPS Case 07-S-0984 report ↗ Consolidated Edison FY2007 Form 10-K, Note H ↗
- Dutch Safety Board, Fatal accident after rupture of expansion joint in steam pipe, October 2025. Cruise ship Nieuw Amsterdam, Half Moon Cay, 22 March 2024: the steam traps on the line had been closed (shut, not failed; the Board could not find out why), so condensate accumulated, and a valve normally left slightly open to keep the pipe warm had been fully closed, making the pipe a dead end; steam hammer, the report’s term, ruptured an expansion joint and two crew members died. Dutch Safety Board investigation report ↗